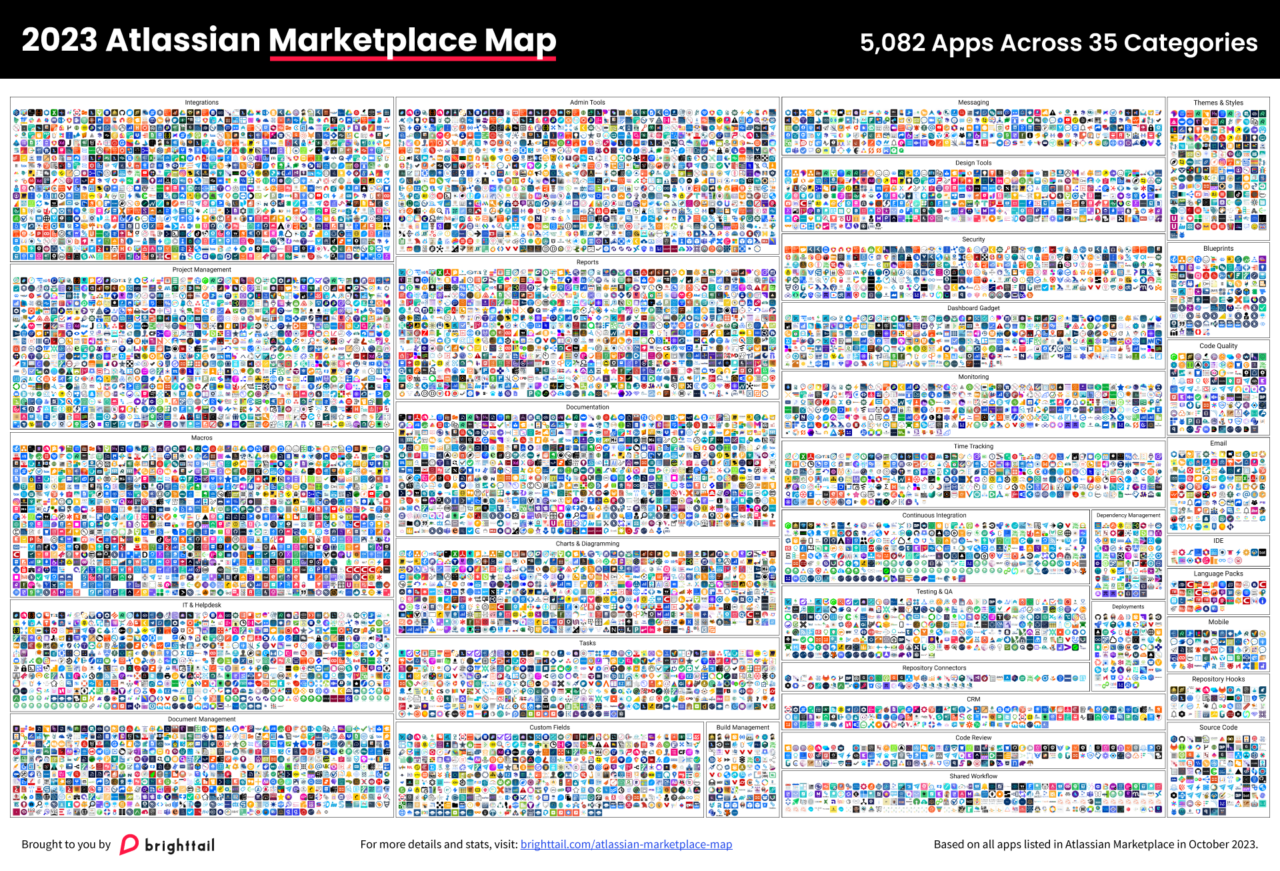
Welcome to the first edition of the Atlassian Marketplace Map!
Like many others, we’ve been amazed at the incredible growth of the Marketplace over the last decade. Originally launched in 2012 as a platform for Atlassian add-on developers, the Atlassian Marketplace has grown from 60 apps in its first year to 5,082 today. That’s a phenomenal 8,370% in just 11 years!
As marketers we’ve seen similar growth in the marketing technology landscape. Every year, chiefmartec publishes a Marketing Technology Landscape Map, charting changes to the martech environment and reporting on the evolution of categories, analyzing the impact of trends like PaaS and M&A, and discussing emerging headwinds and tailwinds.
We were inspired by chiefmartec to create a similar ecosystem map for the Atlassian Marketplace. Assuming that this provides value to the partner ecosystem, we intend to produce this map every year.
Consider this 2023 edition as our baseline. Future editions will include deeper analysis of key changes within the Marketplace ecosystem as well as the drivers behind those changes.
Why We Conducted This Study
If you’re developing apps for the Atlassian Marketplace, understanding the landscape is crucial. To craft a strategy for success and measure performance, you need to know how much competition you have and how your apps compare.
The Atlassian Marketplace’s platform makes it easy for Partners to start selling their apps, even without a marketing or sales team. In the past, a one-person company with a single app could immediately take off alongside bigger players. But is that a realistic expectation today? It really depends on several factors, and you need solid data to gauge how your app measures up.
But concrete data and statistics can be hard to come by; there was no single source of information on all the Marketplace apps and their performance…until now! We’ve mined the Atlassian Marketplace and dug up the insights you need to answer your burning questions:
- How many installs can I expect?
- How many apps are there in each category?
- Which categories find most success?
- Are companies with large portfolios of apps more successful?
- …and more!
Here’s what’s happening right now in the Atlassian App Marketplace, so you’ll have the benchmarks you need to predict and plan for success. Let’s get to the facts.
Atlassian Marketplace Apps by Category and Partner Company Size
In this section, we’ll get into how many apps are in the Marketplace, which categories dominate, how many Partners there are, and how many apps they’re each putting out.
How many apps are there in the Atlassian App Marketplace?
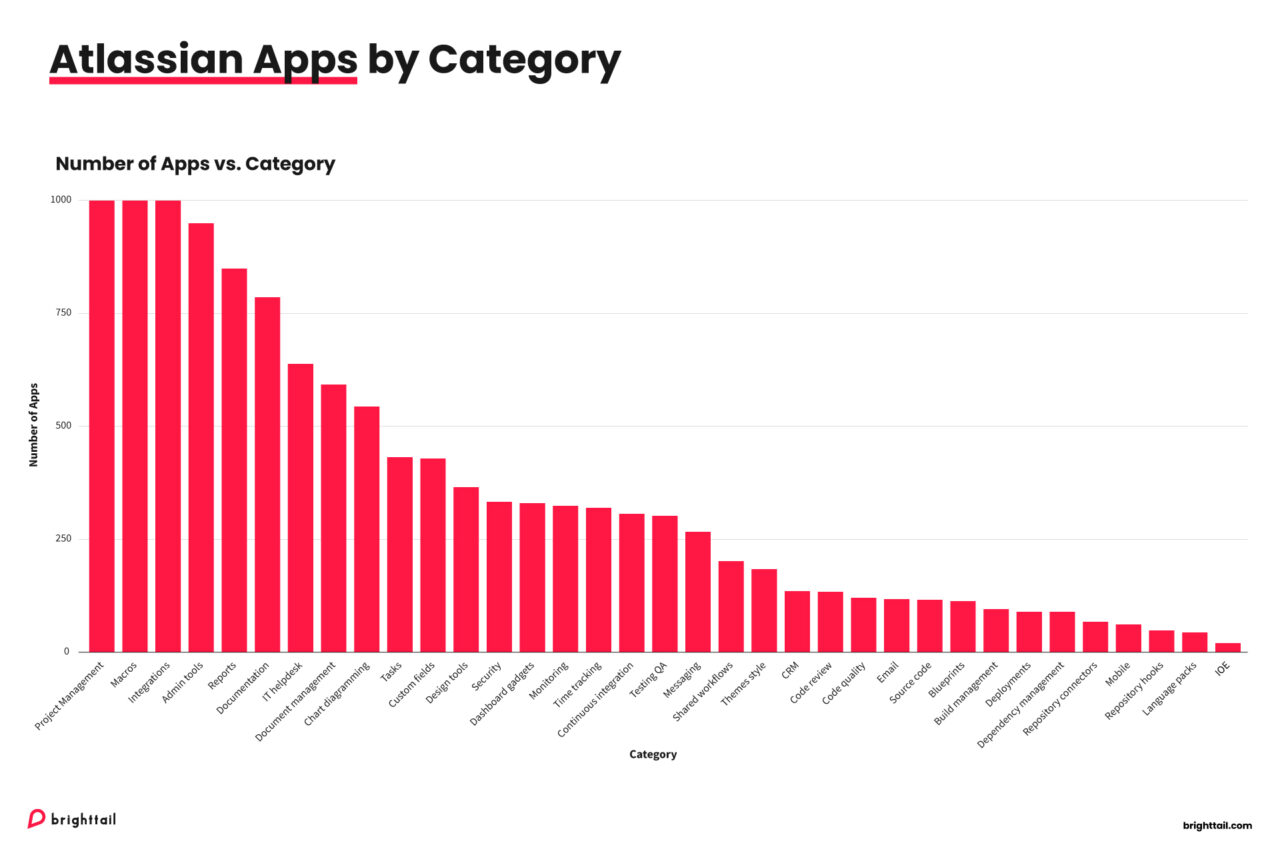
As of October 2023, there were 5,082 active apps including Atlassian apps in 35 categories. That’s a lot of competition! But keep in mind, you’re not directly competing against all of these. We further broke them down into categories, so you can see where you stand.
Top Three Categories
- Project Management
- Macros
- Integration
Bottom Three Categories
- Repository Hooks
- Language Packs
- IDE
Here’s a visual of the category breakdown:
We’ll cover more on the categories’ popularity and potential opportunities later. Next, let’s look at your fellow Atlassian Partners.
How many Atlassian App Partners are on the Marketplace?
There are 1,600 Atlassian app partners, all of different sizes, with some developing only one app and others a large portfolio.
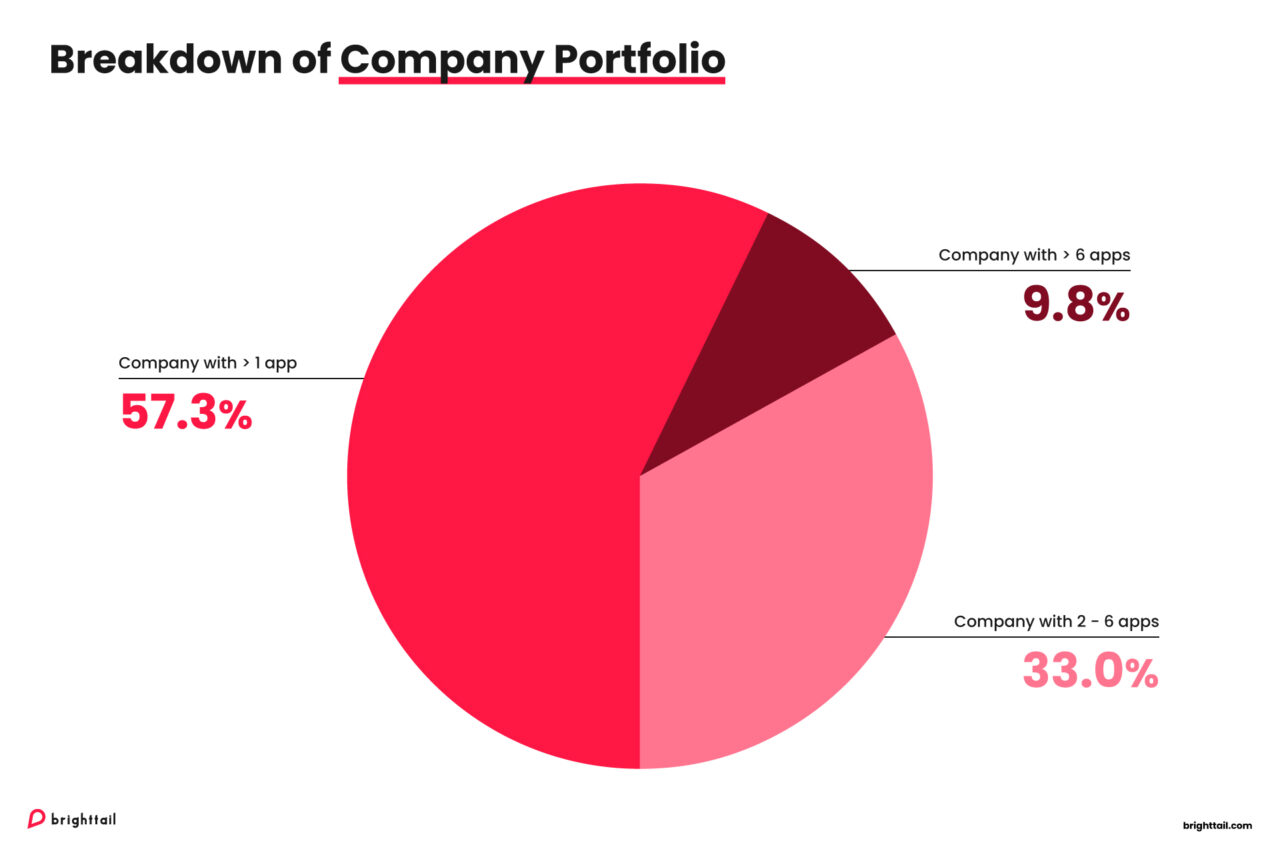
On average, an Atlassian app partner has 3 apps with a median of 1. Single-app companies comprise 57.3% of Atlassian Marketplace partners. Marketplace partners on average develop apps for approximately 3.8 categories with a median of 3.
Does It Pay to Have a Large Portfolio of Apps?
On the surface, yes. Large portfolio companies enjoy better market visibility with higher installs and reviews, while small portfolio and single-app companies face challenges in this area.
However, across the board, we found that user engagement and satisfaction, represented by ratings and reviews are the keys to success, regardless of company size.
Atlassian App Marketplace Partners by Portfolio Size
Here’s how we broke down our research into Atlassian Marketplace Partners:
- Companies with large portfolio (> 6 apps)
- Companies with small portfolio (2 – 6 apps)
- Companies with a single app
Atlassian App Ratings and Installs by Company Size
Now, we’ll dive into the details of how many installs companies are getting and how their apps are rated.
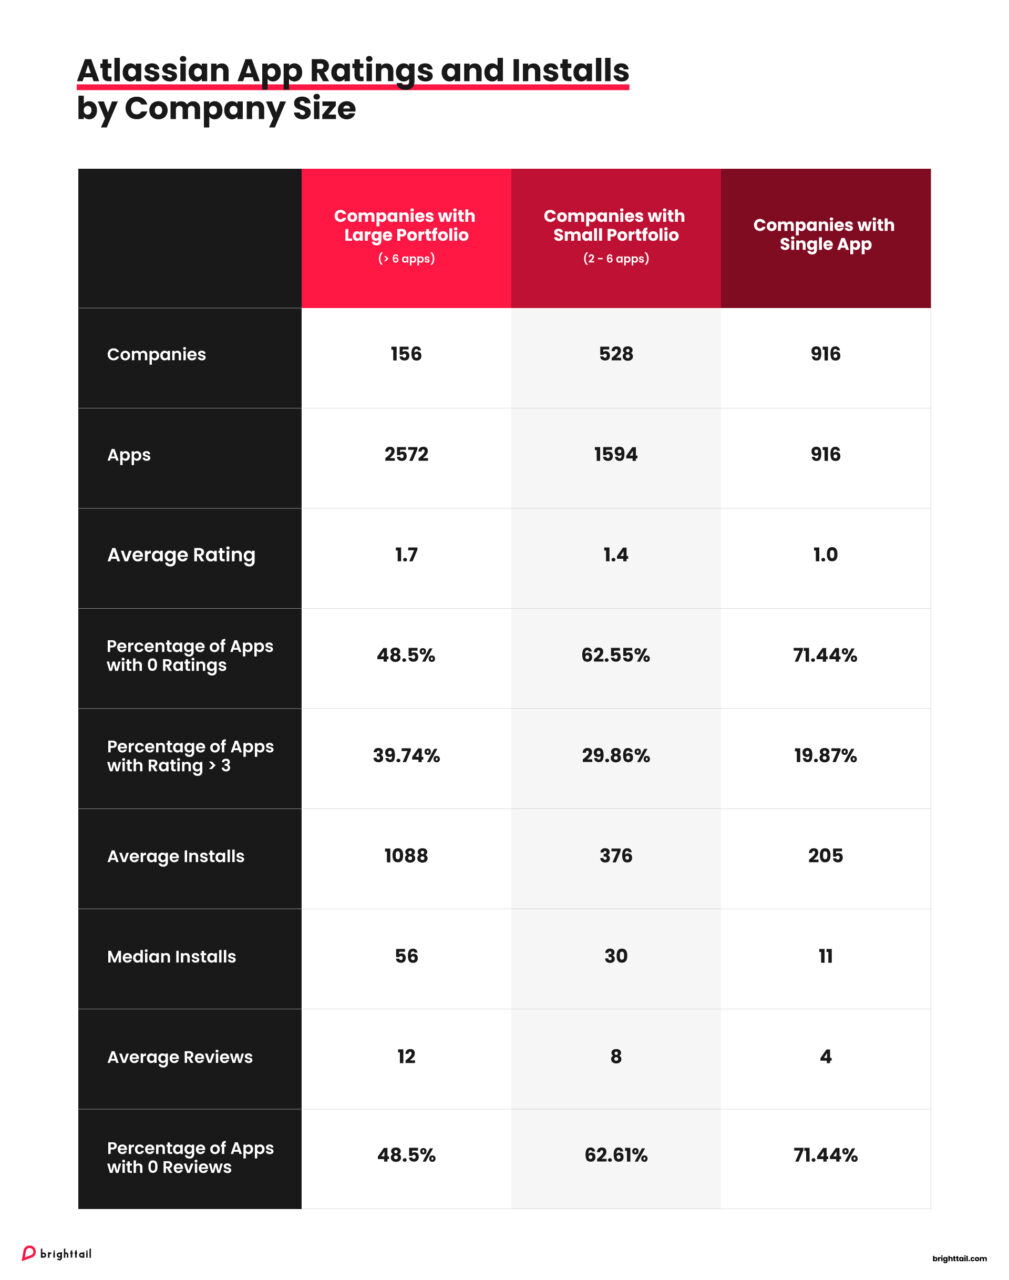
An important thing to take note is that the Atlassian Marketplace rating scale is 0-4, and many apps have quite low engagement. Pay closer attention to the “Percentage of Apps with Rating > 3;” this gives you a clearer picture of the companies’ overall success. Also, we should also take into consideration that 53% of apps have ratings of 0 and 57.7% of apps have zero reviews. However, we found that companies with more apps tend to have a lower percentage of their apps with zero reviews from our analysis.
Key findings
- Large-portfolio companies tend to have higher average app ratings and a greater percentage of apps rated 3 or higher, indicating better user satisfaction.
- Small-portfolio companies exhibit moderate user satisfaction, with potential for improvement.
- Single-app companies struggle with user satisfaction, having the lowest average ratings and fewest apps rated 3 or higher.
- Each cohort exhibits distinct strategic focuses, from diversification in large portfolios to specialization in single-app companies.
- Single-app companies are the most vulnerable, while large-portfolio companies benefit from reduced vulnerability due to their diversified offerings.
How do you fare against your app class? From these findings, one of the most important lessons is that you must proactively drive engagement. If you don’t—it doesn’t matter if you have 1 app or 10—your app will languish among thousands of others unnoticed.
So, what can you do to drive engagement? In the next section, we look further into app installs in different categories and how you can take advantage of popularity or gaps in the market to make your app stand out.
App Installs in the Atlassian Marketplace: Discovering Opportunities
We’ve covered the stats on what Partners are doing; now we’ll move on to the customer and install data, so you can learn from their behavior.
Atlassian reported more than 260,000 customers globally in almost every industry across approximately 200 countries in its 2023 annual report. From those customers, there were 3,651,734 app installs and an average of 707 installs per app to date. That’s a huge market!
Here’s the number of installs by category:
Top 5 App Categories by Number of Installs
- Project Management
- Charts Diagramming
- Integrations
- Reports
- Macros
From all of those app installs, the Project Management category has the highest demand with app installs 4x more than the second category, Charts Diagramming, followed by Integrations, Reports and Macros. From this trend, we observe that Atlassian users prioritize project management enhancements and seek greater visualization and reporting capabilities.
It’s also useful to note that these users may have a need for customization and the enhancement of native interfaces and workflows as we can see high app installs for Macros, Dashboard Gadgets, Custom Fields, and Design Tools.
On the other hand, there is lower interest in specific development tools such as Source Code, Repository Connectors, Continuous Integration, Code quality, and Code Review, implying that either the native functionality meets the needs of the users or that users prefer other platforms for these specific tasks. That could also be said for support and QA tools like IT Helpdesk & QA, Testing, and Deployments categories.
When this insight is paired with the number of apps available for each category, it helps unlock deeper insights into the behavior of Atlassian tools users, revealing potential opportunities and pitfalls.
Stand Out in a Popular Category
Popular app categories can be a challenge to break into but offer high potential for an outstanding app.
If a category has a high number of apps but a lower average number of installs per app, this could indicate a saturated market with no single app meeting user needs effectively. Partners could analyze why the current apps are not achieving more installs – is it a lack of key features, poor user experience, or inadequate marketing? Creating apps that significantly improve upon these areas might be your key to success.
The following categories may benefit from highly differentiated products that can stand out in a crowded market:
- Macros: 1000 apps with an average of 494 installs per app.
- Integrations: 1000 apps with an average of 606 installs per app.
- Admin Tools: 871 apps with an average of 381 installs per app.
- Project Management: 1000 apps with an average of 2026 installs per app.
- Reports: 779 apps with an average of 586 installs per app.
Macros, Integrations, and Admin tools categories are populated with a significant number of apps, but the average number of installs isn’t exceptionally high (where the average number of installs per app across all categories is 645 and top performing categories have an average number of installs of 1783), which could indicate that the market is saturated, but users might still be looking for an app that better meets their needs.
On the other hand, Project Management and Reports categories have a high number of apps, but they also have relatively high average installs, which could mean high demand but with stiff competition.
Find and Fill Gaps in the Market
Categories with a smaller number of apps but high install rates suggest high demand and user satisfaction with the existing solutions. This is an opportunity for Partners to introduce additional innovative products that can compete with or improve upon the existing apps. The focus should be on differentiation and adding value that is not currently provided by the existing apps.
The following figures suggest that these categories might be ready for additional innovative solutions due to the higher average install rate per app and a lower number of competing apps:
- Repository Connectors: 48 apps with an average of 1,289 installs per app
- Repository Hooks: 44 apps with an average of 1,217 installs per app
- Mobile: 52 apps with an average of 240 installs per app
The Majority of Apps Fail to Gain Traction: Learn from the Best
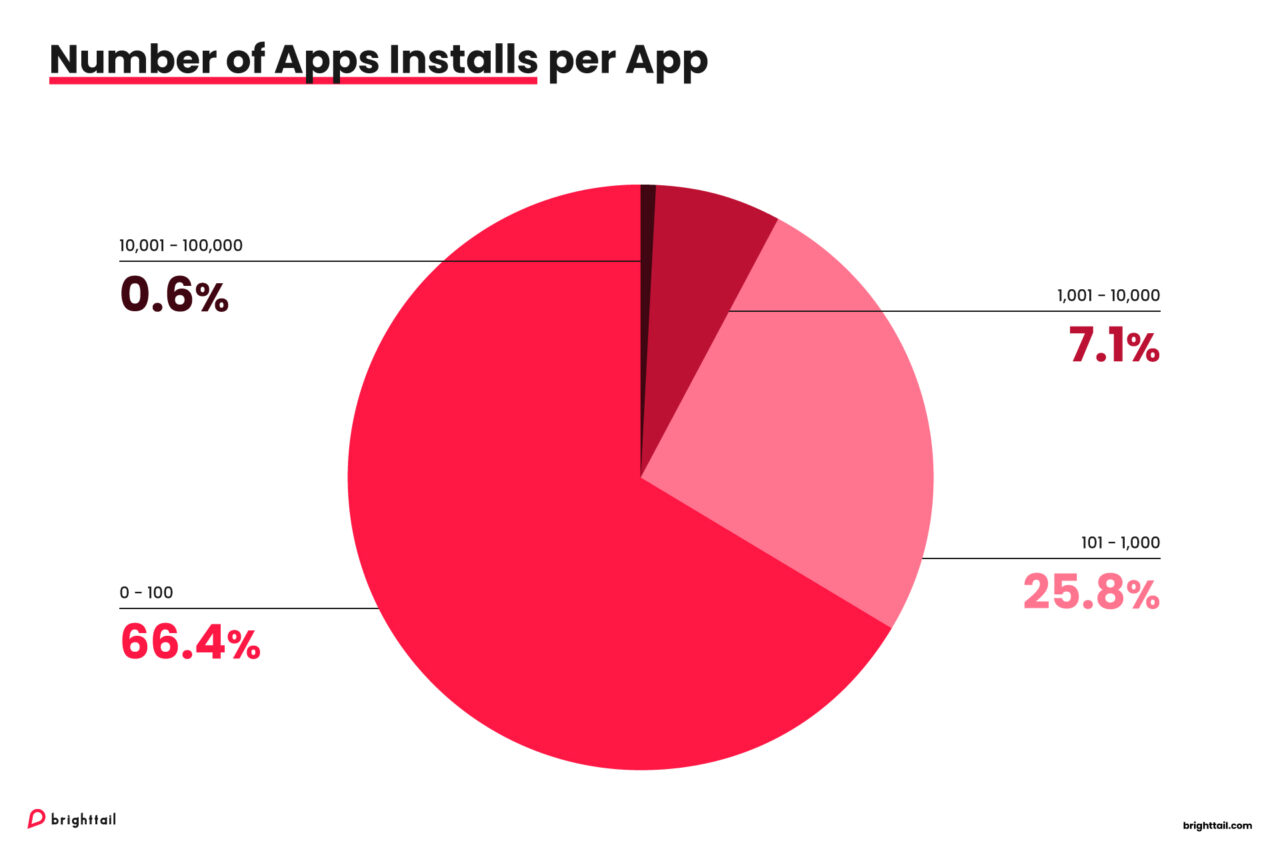
Here’s a finding that may be surprising: the majority of the apps (67%) have less than 100 installs.
It’s easy to get your app listed, but the risk of being overlooked is high. App quality and differentiators are vital to standing out in a saturated market.
Even high-quality apps that fulfill every need won’t market themselves. Just having a listing is not enough. A website, social media presence, and active engagement with customers are crucial.
What can we learn from the top third-party Atlassian App Partners?
| Company | No of Installs | No of Apps |
|---|---|---|
| Appfire | 253,717 | 189 |
| //SEIBERT/MEDIA – Draw.io | 146,100 | 2 |
| Tempo Software | 94,379 | 19 |
| HeroCoders | 67,500 | 7 |
| SmartBear | 55,704 | 10 |
| Adaptavist | 48,291 | 16 |
| Lucid | 41,229 | 8 |
| GitLab | 36,500 | 1 |
| Figma | 35,500 | 2 |
| Miro | 33,984 | 3 |
Diversification Wins: Appfire’s significant number of installs suggests that a diversified portfolio can cater to various user needs and improve market presence.
Niche Expertise: Tempo Software’s strong showing indicates that apps focusing on niche capabilities, such as time tracking, can achieve substantial success.
Integration and Utility: //SEIBERT/MEDIA – Draw.io, HeroCoders and SmartBear high install count highlights the importance of apps that integrate well with Atlassian products and offer significant utility.
Strong Community and Ecosystem Engagement: Adaptavist’s installs demonstrate the benefits of engaging with the community and providing robust support.
Leverage Brand Strength: GitLab, Lucid, Miro and Figma, known for their standalone services, demonstrate that strong brand recognition can be leveraged to drive installs within the Atlassian Marketplace.
Complementary Tools: The success of apps that complement the core functionalities of Atlassian’s products (like diagramming, whiteboarding, and design tools) suggests that Partners should consider building apps that enhance and extend the native capabilities of the platform.
How Does Ranking Work in the Marketplace?
Atlassian provides documentation explaining how search results and rankings are determined in the Atlassian Marketplace. Understanding how the ranking system works is essential for optimizing your app listings to achieve better visibility and reach within the Marketplace.
In a nutshell, the ranking of apps is determined primarily by search relevance and supported by several tiebreaker metrics: a high number of active installations, positive ratings and reviews, and those that are Paid via Atlassian.
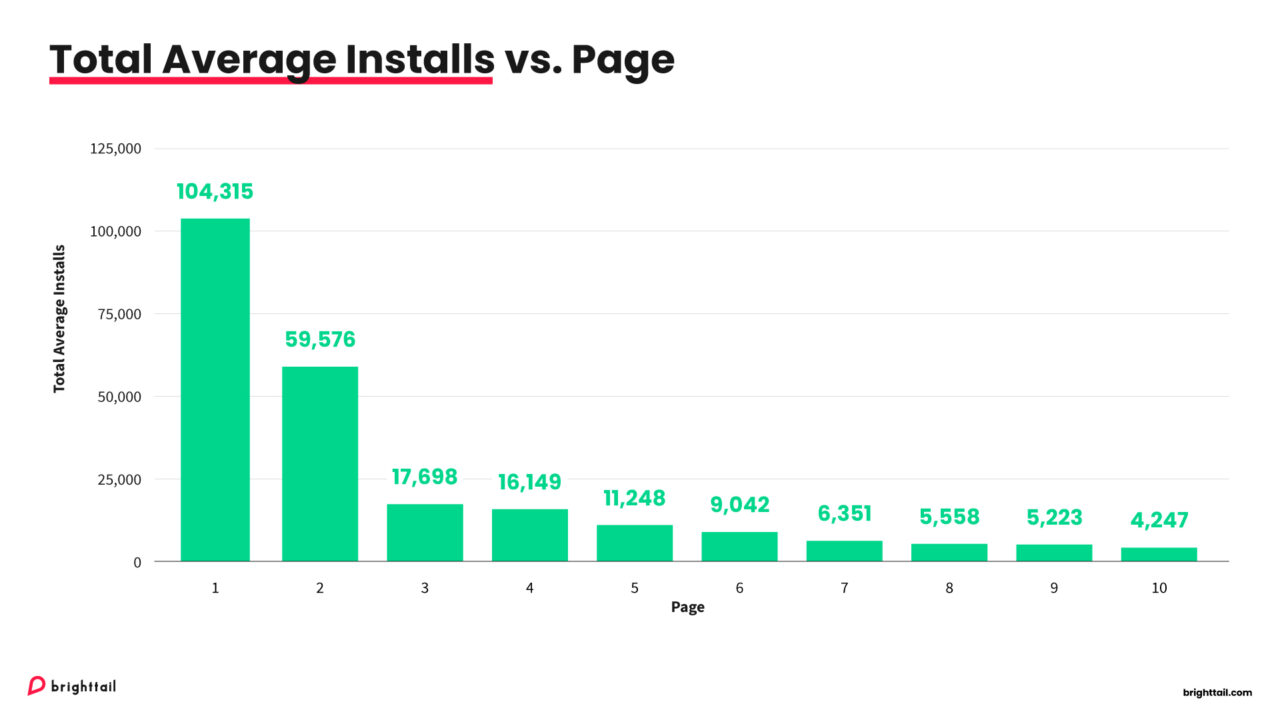
Digging into this further, we looked into each page of the Marketplace listings to see what affects the listing position on the search page. Each page features 24 apps, ranked based on the number of installs. The average number of app installs accumulated in the first page is significantly higher than the second page and onwards.
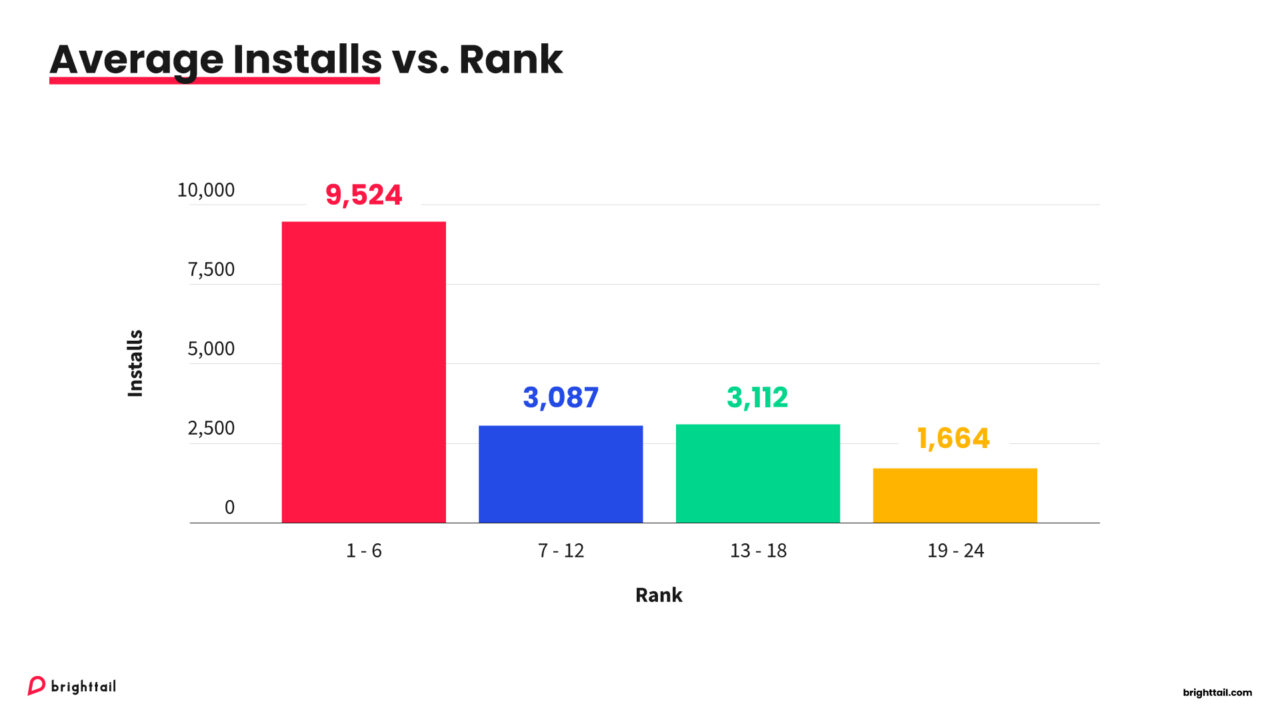
The first 6 apps on the first results page have a higher number of average installs compared to the lower positions on the page.
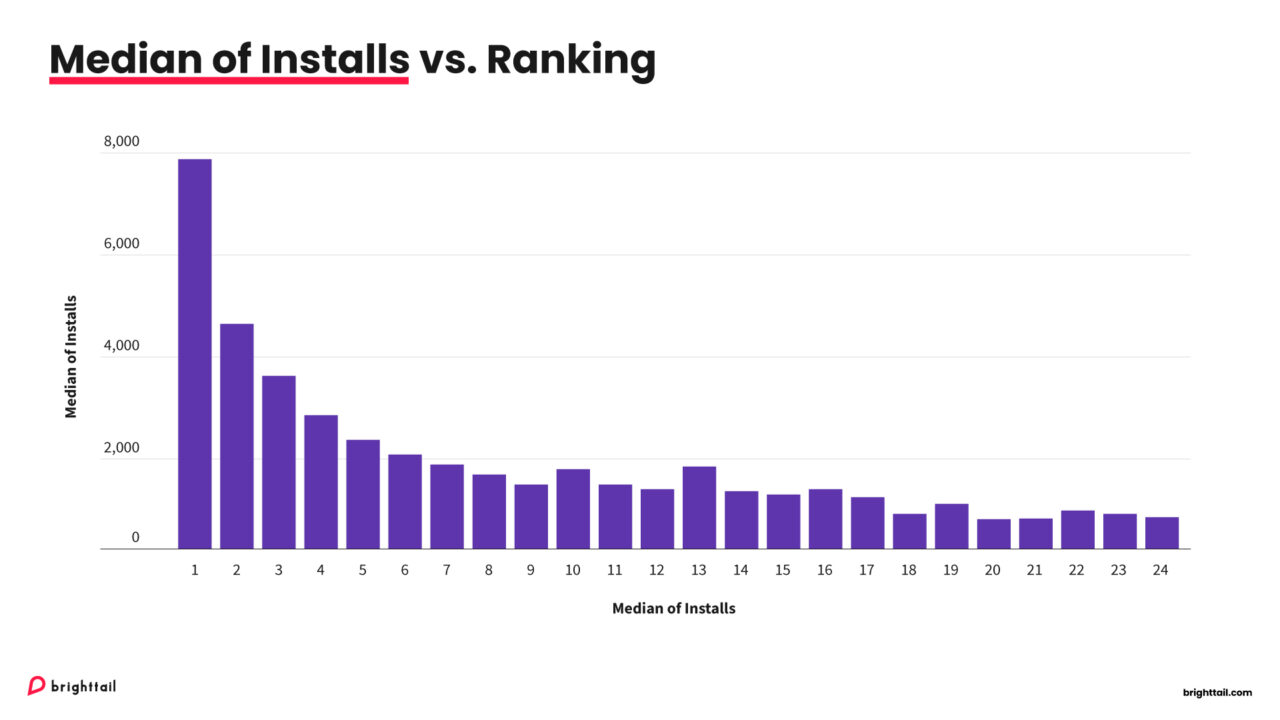
Breaking this down further, here is the median number of installs in terms of respective ranking position on the first page:
The findings are consistent and align with Atlassian’s documentation. The higher your average number of installs, the higher you appear on the Marketplace search results page, making it easier for users to discover your product.
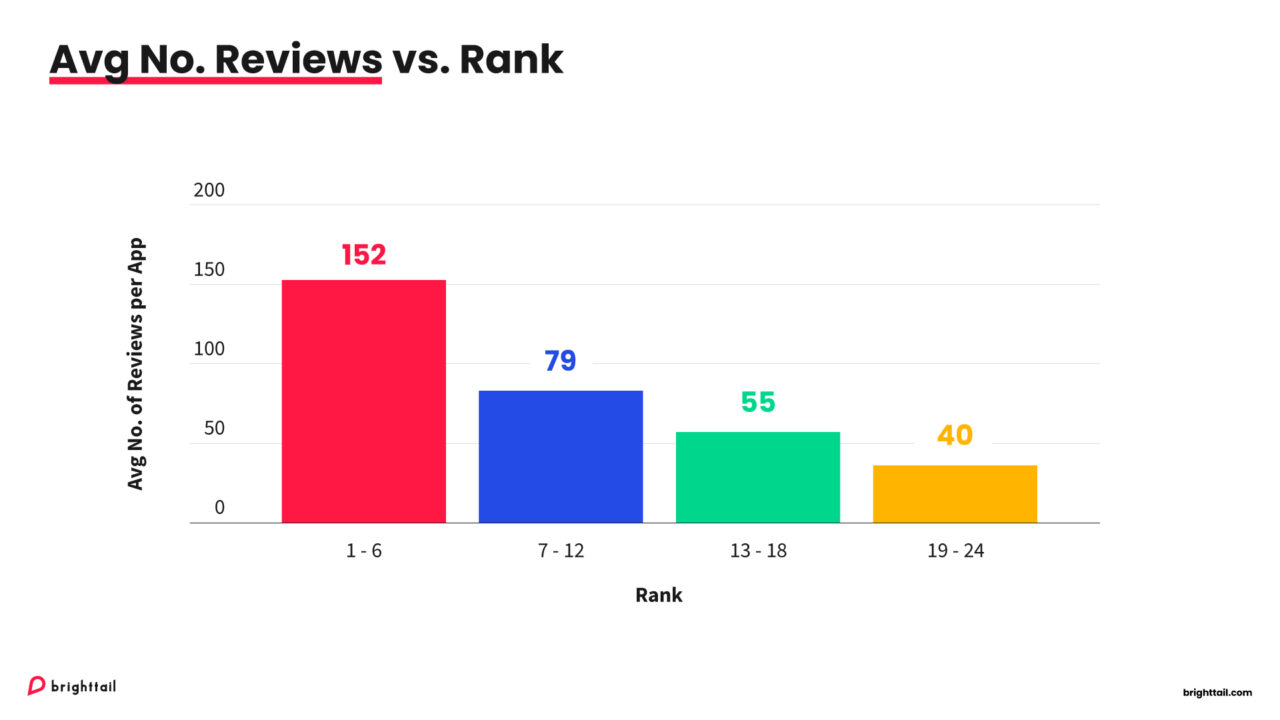
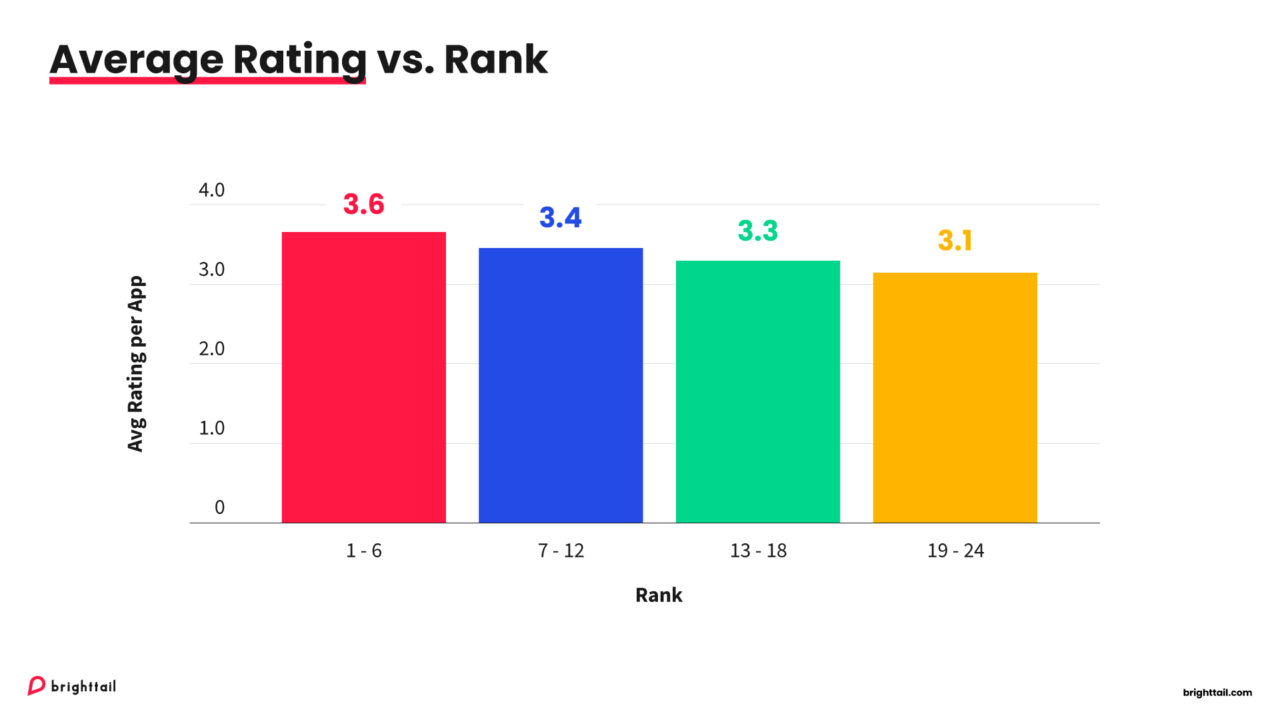
Another interesting observation is that the amount of reviews also affects the position of the apps on the listing page. Apps with more reviews are more likely to achieve higher rankings.
However, when it comes to ratings, the relationship between ratings and rankings appears less clear-cut. It seems that having a higher rating could positively affect an app’s ranking but it is not the sole determining factor.
From these findings, Partners could benefit from actively encouraging user reviews to improve app visibility and ranking. Aside from that, focusing on quality could also provide an unfair advantage by improving ratings to give that much-needed boost to the top rankings.
Leverage Marketplace Knowledge to Your Advantage
Getting noticed in the Atlassian Marketplace is no easy task, but armed with this knowledge, you’re equipped to take on the challenge. Don’t let your app languish on the sidelines. Some strategies like diversification may take months or even years. But others, like positioning your app and driving engagement are actions you can start working on today.
Looking to boost your app’s presence and growth in 2024? Take a look at our definitive guide to Atlassian Marketplace listing optimization and watch this on-demand webinar, “3 Plays to Accelerate Your Marketplace Growth” for some practical advice. If you need help, contact us for a free consultation.
